COPYRIGHT
1999
GALAXIES AT HIGH REDSHIFT:
QUASARS
How quasars were
discovered:
During the 1950’s, a number of radio surveys were
done on the sky. On some of these radio maps were what
seemed point sources. It wasn’t until 1960 when
Thomas Mathews and Allan Sandage looked at one of the
point sources in the constellation Triangulum. What they
observed was a 16th magnitude star like object that
looked blue in colour. This object was designated 3C 48
(object 48 in the 3rd Cambridge catalogue of radio
sources). Three years later the object 3C 273 was
observed as a 13th magnitude object in the constellation
Virgo. Still at this time nobody had any idea as to what
these objects were. This was mainly due to the fact that
the emission lines did not match any normally observed in
stars and galaxies.
|

|
PHOTOGRAPHIC PLATE
SHOWING 3C 273
CLICK ON IMAGE
FOR LARGER VIEW. (SIZE ?)
|
Soon however the problem was solved. Maarten Schmidt
from Caltech discovered that the normally familiar Balmer
lines from Hydrogen was shifted so far towards the red,
that they had gone unnoticed. The redshift of 3C 273 was
calculated to be 0.158 and using the relativistic Doppler
equation, its’ recessional velocity was found to be
14% of the speed of light. Other quasars had redshifts
that exceeded this and it was soon found that the
emission lines that would usually be observed in the
Ultra Violet was shifted into the visual. The
Earth’s’ atmosphere is opaque above 2900
Angstroms, so to observe these objects it was important
to get observatories above the atmosphere.
|

|
SPECTRA OF 3C 273
SHOWING THE REDSHIFT
CLICK ON IMAGE
FOR LARGER VIEW. (SIZE ?)
|
The astronomers found that because quasars emit more
ultraviolet light than stars of similar colours at larger
wavelengths, the index U-B is less than -0.4 (for 3C 48,
U-B=-0.61). This allowed them to achieve a quantitative
search for quasars visible in telescopes. This formula
works fine although quasars at a very high redshift
appear redder. It was also found that although 3C 48 and
3C273 were radio emitters, the majority of quasars are
either non emitters or weak emitters.
What is a quasar?
Quasars are thought to be the highly luminous, dense
cores of galaxies. They somehow consume material from
their host to produce an object that is so intrinsically
bright that they appear starlike. It was once thought
that not all quasars resided within galaxies. This posed
a large problem when considering how the quasar obtained
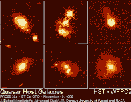
its material. Then in 1996 high resolution photographs
were taken of many quasars which resulted in the
discovery of their host galaxies. So it seems that all
quasars are within a galaxy of some size or type.
|

|
HUBBLE TELESCOPE
PICTURES OF QUASARS AND THEIR GALAXIES
CLICK ON IMAGE
FOR LARGER VIEW. (SIZE ?)
|
The quasar 3C 273 shows just how luminous these
objects are. It has an apparent magnitude of about 13,
yet has a distance of over 800 MegaParsecs (depending on
the value of the Hubble constant, here it has the value
of 55). The average range of absolute magnitude of
quasars is between -24 and -30, where as the most
luminous galaxy is around -23 (again depending on the
Hubble constant). So there must be an astonishingly large
amount of matter being consumed by these objects.
One theory as to what they are is that of a
supermassive black hole. These objects can have a mass of
around 109 solar masses, while their
Schwarzchild radius is around 3´109 km or 20
astronomical units. The assumed model for a quasar is an
object that has material falling from a nearby area into
an accretion disk which then spirals into a black hole.
From this black hole are two jets of material shooting
off into space in opposite directions to one another.
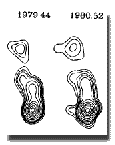
This jet has been observed in many quasars, most notably
3C 273. If the quasar is radio loud (as is 3C 273), then
radio lobes may also protrude away from the object. When
3C 273 was first being studied, astronomers used a lunar
occultation to accurately pin point two radio sources 20
arcseconds from one another. The visible component was
observed at one of these sources. The other source is
thought to be part of a radio lobe. The lifetime of these
lobes can be easily calculated and range between
107 and 108 years.
|

|
RADIO LOBES PROTRUDING
FROM THE QUASAR 3C 345
|
What quasars can teach
us:
A quasars spectra can be split up into two component
parts. One is the large emission line from the quasar
itself, the other the short thicket of lines going
towards the blue end of the spectrum. Both of these are
Hydrogen Lyman Alpha lines and are created when an
electron jumps or drops between the two lowest energy
levels.
The absorption lines on the blueward side of a quasars
spectra are due to the interaction of light with Hydrogen
clouds. These clouds lie in-between the quasar and the
Earth.
|

|
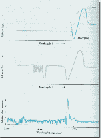
THIS SERIES OF GRAPHS
EXPLAIN WHAT WE SEE
CLICK ON IMAGE
FOR LARGER VIEW. (SIZE ?)
|
- The top graph is that plotted as if the universe
was completely homogenous. Each area of matter will be
infinitesimally redshifted from its neighbour and so
leads to a smooth absorption line.
- The middle graph shows what the absorption line
would look like if the inter galactic medium were made
up of separate gaseous areas at different
redshifts.
- The bottom graph shows what is actually seen. It
shows that the inter galactic medium is made up of low
density homogenous matter interspersed with higher
density clouds.
As each Lyman alpha line is located at a different
wavelength, it is clear that they are produced by a
number of clouds, each line represents a single cloud.
Knowing how much the line has been redshifted can give
astronomers an estimate of the clouds distance. The Lyman
lines seem more abundant at higher redshifts, this has
lead to theories that these clouds are pre-galactic in
nature and may be the fragments that collapsed to produce
galaxies.
|

|
GRAPH OF REDSHIFT VERSUS
ABSORPTION
CLICK ON IMAGE
FOR LARGER VIEW. (SIZE ?)
|
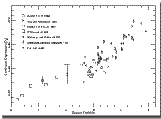
The above graph shows the absorption of the quasars
light when plotted against redshift. It can be seen that
the lower the redshift, the more absorption by Hydrogen
clouds. For a redshift of 4 for example, only half of the
light reached Earth. This tells us that the gas clouds
were more abundant in the past than they are now. One
piece of evidence for this is the fact that the clouds
seem ‘metal free’ (astronomers terming any
element heavier than Helium a metal). However recent
results have shown metal lines in some of the Lyman
forests.
These lines can be split into two parts, those with
Z<1.5 and those with 1.2<Z>3.5.
- The metal lines with Z<1.5 are mainly Magnesium
(Mg II) and are due to halos around normal galaxies or
regions of star formation. The redshift distribution
of these lines corresponds to the expected
distribution of galaxies at the epoch when the
universe was a factor of 1+Z smaller. Some of these
lines have been visually identified as galaxies with
redshifts of less than one.
- The metal lines that lie between 1.2 and 3.5 are
mainly Carbon (C IV) lines due to clouds in young
galaxies that are ionised by hot OB stars.
Studies into quasars and the intervening matter show
that a typical Lyman gas cloud has the mass of a few
hundred Suns, and that they number into the thousands,
yet occupy only a small area of the universe. They also
tell us that the gas halo that surrounds a galaxy extends
further than previously thought. The fact that these
metal lines exist in the Lyman clouds and galactic halos,
means there must have been at least one generation of
star at this epoch to undergo supernova explosion. These
elements could only be produced by nucleosynthesis and
not from the big bang. As these quasars can have very
high redshifts, it shows that star and galaxy formation
occurred when the universe was only a few percent of
its’ current age.
|

|
GRAPH SHOWING THE AGE OF
QUASARS
CLICK ON IMAGE
FOR LARGER VIEW. (SIZE ?)
|
This is also shown by the distribution of redshifts of
quasars. It can be seen that the ‘age of
quasars’ lie between the redshifts 2 to 2.5. Also
that a quasar existed when the universe was about 7% of
its’ current age shows that galaxies must have
evolved at this period. However at this epoch, it has
been calculated that only a few percent of galaxies
actually had quasars residing in them. This does not mean
that only a few galaxies will ever develop quasars. It
means that we cannot detect exceptionally high redshift
quasars as of yet. However the most likely reason is that
quasars are short lived. They have all died out by half
the age of the universe. The fact that our galaxy and our
near neighbours do not seem to have visible quasars also
backs this hypothesis.
Now if the majority of galaxies did have quasars
within them, then the galaxies that are close to us
should have quasar remnants. Studies of the 1.3 cm
H2O line from the galaxy NGC 4258 revealed
that stars were revolving around a massive black
hole.
Conclusion:
Quasars are probably one of the most important, yet
far from understood phenomenon in the known universe.
They have proved useful, not only in their study, but of
the universe as a whole. They can tell us a lot about
early formation of galaxies, the matter that lies between
the galaxies, dust and gas clouds, high density matter
and cosmology. Finding quasars and using quasars as
beacons to show the furthest and faintest of objects can
help astronomers understand the universe at very early
epochs.
Bibliography:
- Beschtold, G. (1997) Shadows Of Creation Sky
And Telescope Sept pp 29-34
- Bruning, D. (1995) A Galaxy Of News
Astronomy June pp 40-43
- Carroll, B and Ostlie, D (1996) Active Galaxies
An Introduction To Modern Astrophysics pp
1167-1214
- Carroll, B and Ostlie, D (1996) Black Holes An
Introduction To Modern Astrophysics pp
661-674
- Hirshfeld, A and Sinnott, R.W (1985) Sky
Catalogue 2000.0 Cambridge University Press Vol.2
pp 35-36
- Narlikar, J (1977) The Structure Of The
Universe Oxford University Press pp 82-87
- Nicolson, I (1996) Black Hole Basics Astronomy
Now Feb pp26-27
- Roth, J (1996) Quasars: Not Naked After All Sky
And Telescope March p 12
- Roy, A and Clarke, D (1989) Quasars Astronomy:
Structure Of The Universe ch 14.4 pp
226-228
RETURN
TO ARTICLES PAGE


