COPYRIGHT 1999
SUPERNOVA
1987A
Introduction
On the night of February 23rd 1987,
Ian Shelton of the Las Camponas Observatory in Chile
observed a very bright star in the constellation of
Dorado; part of the Large Magellanic Cloud. What he
discovered and was very soon verified by astronomers
around the world was a Type II supernovae. This discovery
as it stands was very important to astrophysics due to
its brightness and near proximity. The timing was also
significant because it could be observed in a number of
wavelength regimes such as Infra Red, Ultra Violet,
visual, radio, x-ray and gamma ray. The last supernovae
visible to the unaided eye was in 1604 which was a Type I
supernova and appeared four years before the invention of
the telescope. SN 1987A as it became designated could be
studied like no other supernova before and
astrophysicists have achieved remarkable results which
have supported as well as opposed the common models about
such events.
Although the official discoverer
was Shelton, other astronomers can also stake a claim to
be discoverer. Richard McNaught of Siding Spring,
Australia observed the LMC only the night before but did
not process his photographic plates until the 23rd. When
he did so, what he saw was a new star of magnitude 6
where the previous night there was nothing to note. An
amateur astronomer called Albert Jones located in New
Zealand, saw the new star only a few hours after Shelton
had photographed it, but what makes him a more important
piece in the jigsaw was what he didn’t see on the
23rd. His failure to notice anything untoward had
occurred in the LMC places a limit to the brightness of
the supernovae on that day.
|
|
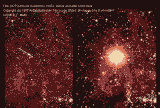
THESE TWO
IMAGES SHOW THE LOCATION OF SN 1987A BEFORE AND
AFTER THE EXPLOSION.
CLICK ON IMAGE
FOR LARGER VIEW. (SIZE ?)
|
The Pre Supernovae
Star
Soon after its’ discovery,
astronomers around the world examined their photographic
plates to see which star had exploded. What they found
was a blue super giant star named Sk -69° 202, that
is star 202 in Nicholas Sanduleaks’ list of bright
blue stars. The -69° comes from its’
declination on the sky.
The Radius Of Sk -69°
202
The radius of the star can be
estimated by using some simple methods.
The distance to the Large
Magellanic Cloud is thought to be 52,122 Parsecs which
gives a distance modulus of 18.85. The apparent magnitude
was estimated from photographic plates taken before the
star turned supernova and is estimated to be
mv=12.24. This gives an absolute magnitude of
Mv=-6.34. So applying a bolometric correction
of 1.26 gives MBOL=-7.6
Now:-


 Where Te is 15,200 for a B3I
supergiant.

The Mass Of Sk -69°
202
As seen above, it is quite easy to
determine the radius of the progenitor, however
determining its’ mass is not so easy. The mass can
only be estimated, as its’ position on the
Hertzsprung-Russell diagram is only loosely constrained.
To make the definition more difficult, there are large
uncertainties in the amount of mass lost during the stars
lifetime. However calculations by Stanford Woosley have
shown the mass to be around 15 times the solar mass. This
was determined by using the flux of neutrinos detected by
the Kamiokande and IMB neutrino detectors. It is
estimated that the flux at Earth was approximately 50
billion neutrinos per square centimetre. This flux obeys
an inverse square law of the form 1/r2, which gives a
signal of between 2 to 3*1053 ergs when using
the distance of the LMC of 160,000 light years. Now it
has been calculated that when 0.1 solar mass of iron is
broken down in to protons and neutrons,
1.7*1051 ergs is carried away in neutrinos.
99% of the binding energy in this process is carried away
by neutrinos, so the mass can be estimated as
follows:-

Multiplied by 0.1 solar masses
gives 11.76 times the solar mass.
And 
Multiplied by 0.1 solar masses
gives 17.64 times the solar mass.
So the estimated mass lies between
11 solar masses and 17 solar masses. Or around 15 solar
masses.
The Optical Light
Curve Of SN 1987A
Hydrodynamical
Time
The effective temperature of the
progenitor governs how much energy is emitted in photons
and at what wavelength. The hydrodynamical time is the
time it takes for the star to cool so that the photons
are emitted in the visual regime of the electromagnetic
spectrum. The reason why this time is important is
because it gives the optical rise time.

This gives a very short time for
the Sk -69° 202 parameters, which is why the visual
decay occurred only hours after the neutrino burst was
recorded at Kamiokande and IMB. A typical SN II
progenitor has a radius of around 1014 cm
which gives a rise time for them about 10
days.
Luminosity Of SN
1987A
The relatively small radius of Sk
-69° 202 is responsible for the low luminosity of SN
1987A and is governed by the relation:-

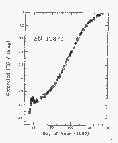
As can be seen from the ultraviolet
luminosity of SN 1987A taken by the International
Ultraviolet Explorer Satellite, there is a rapid rise to
a maximum, then a sudden decline within 15 days from core
collapse. This can be explained by adiabatic cooling of
the photosphere, the colour of the star quickly moved
from blue to red. This occurred comparatively quickly for
SN 1987A due again to its’ small radius.
|
|
THE
ULTRAVIOLET LUMINOSTY FOR SN 1987A FROM DAY 50
TO DAY 140.
CLICK ON IMAGE
FOR LARGER VIEW. (SIZE ?)
|
The Neutrino
Burst
One of the amazing things about SN
1987A was the fact that it was detected by two neutrino
instruments only hours before it was discovered visually.
The two neutrino detectors in question are the Kamiokande
in Japan and the IMB in Ohio, USA. Both these detectors
are of the same basic design. They consist of a large
tank of very pure water with 2,000 light sensors immersed
in it. When a neutrino enters the tank and hits a proton
or electron in the water, Cerenkov radiation is emitted
which is then picked up by the light sensors. Because
neutrinos are very light, they very rarely interact with
particles. It was typical to detect an extra solar
neutrino once in every five days.
However on the 23rd of February
1987, eight neutrinos were detected by the IMB at the
same time as the Kamiokande registered 11 neutrinos. This
time which was recorded by computer is thought to result
from the neutrino burst from SN 1987A as its’ core
collapsed. These two large detectors were not the only
ones on Earth to register something that day. The Mont
Blanc detector underneath the Alps recorded several
events, but at a different time to the Kamiokande and IMB
detectors, it is still unknown what significance this has
to neutrino astronomy and SN 1987A in particular. The
other detector called the Baksan Detector underneath the
Caucasus mountains also recorded neutrino events, but as
they were received just below its’ working
threshold, this data was ignored by the astrophysicists.
It was these detectors that helped put a limit on the
mass of the neutrino and so may help explain some of the
missing mass in the universe.
|

|
THIS
DIAGRAM SHOWS THE NEUTRINO EVENTS FOR THE
KAMIOKANDE AND IMB DETECTORS OVER A PERIOD OF 14
SECONDS.
CLICK ON IMAGE
FOR LARGER VIEW. (SIZE ?)
|
The Life Of A 20 Solar
Mass Star
The progenitor star Sk -69°
202 was formed around 10 million years ago and lived the
past 9 million years like other stars; fusing hydrogen
into helium to produce energy. After the hydrogen had
been consumed, a helium core of 6 solar masses was left.
The central regions contracted, heating up as it did so.
Hydrogen fusion continued in a thick shell around the
core while the stars outer layers expanded. When the
central core reached a temperature of 170 million degrees
Kelvin, helium began to fuse to produce more energy. The
radius of the star was now around 108 km while
the luminosity was about 100,000 times our suns’.
The star had now entered its’ red supergiant phase.
Helium fusion lasted about a
million years producing a 4 solar mass core of carbon and
oxygen. It was at this stage of the stars life that it
lost a large amount of material in the form of a stellar
wind. Eventually, the helium fusion ceased at the core
and again the star contracted. The luminosity diminished
by such an amount that the outer red giant envelope could
not be supported and so was lost to outer space. The
central part of the star contracted by a factor of 10
heating up so much, it entered its’ blue phase. The
central core had now reached 700 million degrees Kelvin
and a new process of fusion began.
Over a period of 1000 years, the
carbon within the core fused together to produce neon,
sodium and magnesium. It was at this stage that electrons
and positrons collided to produce neutrino-antineutrino
pairs. These neutrinos escaped very easily and so took
away more energy than radiation from the surface. The
next stage called neon burning occurred when the carbon
had been exhausted. Neon fused together at a temperature
of 1.5 billion degrees Kelvin to produce oxygen and
magnesium. This phase only lasted a few years and was
followed by oxygen burning which created silicon and
sulphur at temperatures of about 2.1 billion degrees
Kelvin.
The final stages of the stars life
lasted only a matter of days and is called silicon
burning. Because silicon and sulphur cannot fuse together
to produce heavier elements, at a temperature of 3.5
billion degrees, a small amount of silicon melted in to
the area of free helium nuclei, neutrons and protons.
These particles then added on to the silicon and sulphur
nuclei to produce elements of the iron group, mainly
54Fe and 56Fe. When the silicon
burning was completed, the star had reached the end of
its’ evolutionary life. No more energy could be
produced by the fusion process.
Throughout its’ life, gravity
had got stronger and stronger with every contraction of
the star and that continued here. The core contracted and
heated up, aided by two other processes; electron capture
and photodisintigration. Because most of the pressure
supporting the star came from electrons, removal of these
electrons allowed the star to contract. These electrons
were lost because they combined with protons inside heavy
iron nuclei. Photodisintigration involved the breaking up
of nuclei by high energy radiation. But this process took
away a large amount of energy that would otherwise be
used to provide heat and pressure. The outcome again was
more contraction of the stars’ core. Due to these
two processes, the core collapsed very fast.
Why Was Sk -69°
202, Blue?
It was soon realised that the star
that exploded was a blue giant as opposed to a red giant
so typical of a Type II supernova. One possible answer is
that before it exploded, Sk -69° 202 had lost so
much matter as a stellar wind that all that was left was
a helium core contracted so much that it glowed a hot
blue colour. Another possibility is the composition of
stars in the Large Magellanic Cloud. These stars have a
tendency to be low in metalicity and so Sk -69° 202
may have evolved through its’ life differently to a
typical galactic star that consists of mainly hydrogen
and helium.
Explosion
Mechanisms
The Prompt Hydrodynamical
Explosion
The core collapses in only a few
tenths of a second, while the density rises to about
1million times its’ previous amount. The outer
layers, that is the neon, carbon, helium and hydrogen
shells, do not collapse inward, but instead hang
suspended. When the density in the core reaches a certain
point, the nuclear forces which usually hold the atoms
together, changes sign and becomes repulsive. The
resistance to further compression is too great and so the
stars’ collapse halts. About half of the iron core
(0.7 solar masses) springs back, blocking the infalling
matter from the outer layers. A shock wave is created at
this intersection of iron core and supersonic infalling
matter. The shock front moves on outward exciting the
rest of the core with 1051 erg which then
blasts the stars outer layers at high velocity in to
space.
The Delayed Explosion
Mechanism
Because 99% of the energy of a
forming neutron star is emitted as neutrinos, it turns
out the neutrino energy is 100 times more powerful than
is needed to produce the shock front that creates a
powerful supernovae. Some of this energy must be
deposited underneath the shock front at the point where
matter is accreting on to the iron core. It is in this
zone that neutrinos and antineutrinos deposit energy to
produce enough heat an pressure to send the shock front
outwards again.
It is still unknown which method of
explosion SN 1987A erupted with, because the observable
properties such as velocity, light curve and spectra only
give data on the energy deposited in the core and not the
mechanism. However it has been found that core masses up
to 1.35 solar mass favour the prompt hydronamical
explosion and core masses greater than 1.35 solar mass
favour the delayed mechanism. The expansion of SN 1987A
will give more detail on the kinetic energy produced by
the explosion and should give a better understanding of
which mechanism occurred inside.
The Light Curve And The Decay
Of 56Cobolt
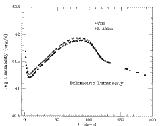
The bolometric light curve of SN
1987A shows a sharp decrease over the first few days,
then a slow increase to maximum around day 80. Then the
curve decreases again and steadies out as shown in the
figure below.
|
|
THE
BOLOMETRIC CURVE OF SN 1987A FROM DAY 0 TO DAY
200. THE DIFFERENCE IN THE TWO CURVES ARE DUE TO
THE OBSERVERS TAKING DIFFERENT AMMOUNTS OF
INTERSTELLAR REDDENING IN TO ACCOUNT.
CLICK ON IMAGE
FOR LARGER VIEW. (SIZE ?)
|
The curve can effectively be split
in to three regions; day 0 to day 10, day 10 to day 40
and day 40 onwards.
Day 0 To Day 10
The rapid decline of the bolometric
luminosity is due to the rapid expansion of the surface
of the star. This expansion caused a decrease in
temperature which was also noted by a rapid colour change
from blue (hot) to red (cooler).
Day 10 To Day 40
This phase of the curve saw a rapid
increase in the luminosity which was mainly due to the
recombination of hydrogen nuclei and electrons which were
ionised when the shock wave passed through during core
collapse. The temperature here levelled off to between
5,000 and 7,000 Kelvin, which is the temperature required
for recombination to occur at the low density of
10-13 gcm-3.
Day 40 Onwards
If the only source of energy in the
supernovae was produced by the shock wave, then the
luminosity would slowly decrease after around day 40.
However it was seen that the luminosity climbed and
peaked at day 85. Some of this energy was created as the
shock front passed through, but as can be seen from the
graph, it decreases linearly through to day 200. There
are two possibilities about what was creating the energy
in this phase. One is energy that is created from a
rapidly spinning pulsar that was formed when Sk -69°
202 went supernova. The second is radioactivity from the
decay of 56Cobalt which was synthesised in the
initial explosion.
The Decay Of
56Cobalt
As can be seen here from the
process of decay from 56Nikel to
56Cobalt and 56Cobalt to
56Iron, the decrease of the bolometric curve
(if powered from 56Cobalt decay) should follow
a similar path to the half life of the decay.


So 
Or 

Where the half life of
56Cobalt is 77.1 days.
So 
This decrease of 0.01 magnitudes
per day is exactly what is seen on the graph from day 130
onwards. The decay of 56Cobalt produces gamma
rays with energies of 847, 1238 and 2599 kev. The delay
in the creation of these gamma rays and their detection
is because they had previously been trapped inside the
expanding shell around the supernova. It was not until
day 150 since core collapse that the shell expanded to
such an extent that the energy could escape. Firstly hard
x-rays were detected, which was due to the energy
decrease from collisions of the gamma rays and particles
in the envelope. Finally gamma rays of 847 and 1238 kev
were detected by the solar maximum mission in August of
1987 proving that 56Cobalt was present in the
supernova and had decayed to
56Iron.
Models Of The
Supernova By Pinto And Woosley
Stanford Woosley from the
University of California has for many years developed
models of supernova explosions using computer
simulations. But it was his teaming up with Philip Pinto
that created ground braking ideas. In their simulations,
the parameters of the star are inputted such as mass,
density, gas pressure, energy release and opacity. The
outcome is a model of how that particular supernova
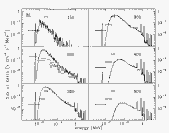
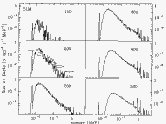
should behave at various wavelengths. Shown below are a
couple of model spectra. One for a 3 solar mass hydrogen
envelope that surrounds a 6 solar mass helium core and an
explosive energy of 6.5*1050 ergs. The other a
5 solar mass hydrogen envelope that surrounds a 6 solar
mass helium core and the same energy output. The first
model, called 3L, obeys the observed x-ray spectra very
well up to day 300 where it clearly decreases in flux
whereas the observations do not. The second model, called
5LM obeys the observations well. An extra parameter
concerning the amount of mixing between the hydrogen
envelope and the helium core was inserted in this model,
but does not prove that it actually happened in SN 1987A.
It is thought that the real model of SN 1987A lies
between these two described above.
|
|
THE MODEL
SPECTRA FOR THE PINTO AND WOOSLEY MODEL 3L. THE
BARS ON THE GRAPHS ARE OBSERVED FLUXES WHILE THE
BACKGROUND IS THE CALCULATED SPECTRUM.
CLICK ON IMAGE
FOR LARGER VIEW. (SIZE ?)
|
|
|
THE SAME AS
THE ABOVE DIAGRAM EXCEPT FOR THE MODEL
5LM.
CLICK ON IMAGE
FOR LARGER VIEW. (SIZE ?)
|
The Ring
Structure
Over the past few years, pictures
from the Hubble Space Telescope have revealed ring
structures around the central star which exploded in
1987. The main ring structure pictured below is about 0.2
Parsecs out from the progenitor and is 0.02 Parsecs
thick. It is thought that this ring structure is formed
by a shock front where the red supergiant matter (blasted
out into space over a million years ago) is interacting
with the fast blue supergiant matter. This interaction
ionises the material, mainly oxygen, nitrogen, hydrogen
and sulphur, brightening the intensity of the
ring.
|

|
HUBBLE
SPACE TELESCOPE IMAGE OF SN 1987A SHOWING THE
THREE RING STRUCTURE.
CLICK ON IMAGE
FOR LARGER VIEW. (SIZE ?)
|
The Spectra Of SN
1987A
At an age of eight years,
astronomers used the Hubble Space Telescope Faint Object
Spectrograph (FOS) to obtain spectra of the material that
now makes up the supernova remnant. It is clear from the
diagram that it is dominated by Hydrogen alpha (6568
Angstroms), oxygen (3734 Angstroms), magnesium (4563
Angstroms), sodium (5889 Angstroms) and calcium (7306
Angstroms). It seems the supernova has now taken a
nebular appearance as opposed to its’ P Cygni
profile it portrayed shortly after core
collapse.
|

|
SPECTRUM OF
SNR 1987A SHOWING THE PEAKS OF VARIOUS ELEMENTS
PRESENT.
CLICK ON IMAGE
FOR LARGER VIEW. (SIZE ?)
|
Conclusion
A wealth of data has been gatherred
on this particular star and its’ supernova event.
Many theories have been backed up not for just this
event, but also for other supernova. Also a grater
understanding of the evolution of stars has been achieved
for stars such as Sk -69° 202 which before this
event was only postulated wether they could turn
supernova. The process of neutrino creation has been
closely examined by astronomers, both in theory and by
observation, streangthening the understanding of these
strange particles. Perhaps one of the forgotten
achievments SN 1987A is the fact that since Februrary
1987, more supernova have been observed in other galaxies
than ever before, not just by professional astronomers,
but by amateurs aswell. Although it has been 12 years
since Sk -69° 202 turned supernova there is still a
lot to understand about such events, this is partly due
to the fact that SNR 1987A is continously changing,
showing aspects of its’ personality that in 1987
were not even thought of. Because of these changes, it
will be a long time yet untill astronomers fully
understand these events and the implications they have on
the universe as a whole.
Bibliography
Borkowski, K.J and Blondin, J.M
(1996) X-Ray and Ultraviolet Line Emmission From SNR
1987A. The Astrophysical Journal, 476: L31-L34.
1997 Feb 10.
Carroll, B.W and Ostlie, D.A (1996)
An Introduction To Modern Astrophysics.
Addison-Wesley Publishing Co. pp 510-528.
Chujai, N.N, Chevalier, R.A,
Kirshner, P and Challis, P.M (1996) Hubble Space
Telescope Spectrum Of SN 1987A At An Age Of Eight Years:
Radioactive Luminescence Of Cool Gas. The
Astrophysical Journal, 483: 925-940, 1997 July
10.
Clarke, D and Roy, A.E (1989)
Astronomy Structure Of The Universe. 3rd Ed. Adam
Hilger, New York. Pp 122-123.
Goldsmith, D (1990) Supernova
The Violent Death Of A Star. Oxford University
Press.
Hasinger, G, Aschenbach, B and
Trumper, N (1996) The X-Ray Light Curve Of SN 1987A.
Astronomy And Astrophysics. 312, L9-L12
(1996).
Kirshner, R.P, Sonnerborn, G et al
(1987) Ultraviolet Observations Of SN 1987A. The
Astrophysical Journal, 320: 602-608, (1987) Sep
15
Michael, E et al (1998) New Hubble
Space Telescope Observations Of High Velocity Lya And Ha
In SNR 1987A. The Astrophysical Journal, 509:
L117-L120 (1998) December 20.
Phillips, M.M and Woosley, S.E
(1998) Supernova 1987A! Science. Vol 240 pp
750-759.
Pinto, P.A and Woosley, S.E (1987)
X-Ray And Gamma Ray Emmissions From Supernova 1987A!
The Astrophysical Journal, 329: 820-830, (1988)
June 15.
Schaeffer, R, Casse, M,
Mochkovitch, R and Cohen, S (1987) The Light Curve Of SN
1987A. Astronomy And Astrophysics, 184, L1-L4
(1987).
RETURN
TO ARTICLES PAGE


![]()
![]()
![]()
![]()
![]()
![]() Where Te is 15,200 for a B3I
supergiant.
Where Te is 15,200 for a B3I
supergiant.![]()


![]()


![]()
![]()
![]()
![]()


![]()


