|
|
|
 |
|
 |
Navigation: Contents: Info: THE
TWO TYPES OF CEPHEID VARIABLE STARS
Cepheids of Population
I Classical
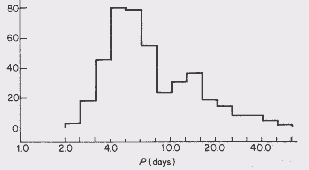
Cepheids Shown below is a histogram displaying
423 classical cepheids. As can be seen there are two peaks,
one between 4 and 6 days and the other between 12 and 15
days. There is a minumum at 9 days and the shortest and
longest periods are 2 days and 50 days
respectively. Histogram of Classical
Cepheid type According to this data, classical
cepheids are split up into two groups. The first group has a
period of between 1 and 9 days. The variations in amplitudes
in this group range from 0.7 to 1.2 magnitudes. The light
curves for stars that lie between 7 and 9 days display a
distinct bump on the descending part of the curve. The
second group of cepheids also displays a bump on the light
curve on the ascending part, these peak for stars around a
period of 15 days but disappears between 25 and 30
days. Cepheids of Population
II CW
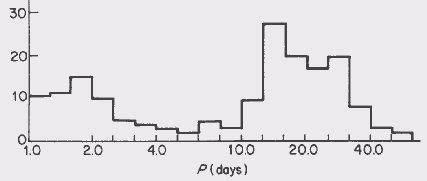
Cepheids As can be seen from the histogram
below, there are two groups of CW Cepheids depending on
their periods. Histogram of CW Cepheid
type There is one group with periods of
between 1 and 6 days, the other group have periods of
between 7 and 50 days. Those stars of periods less than 2.5
days show a perculiar light curve which displays two bumps,
one on the ascending part and another on the descending
part. In the second group it is typical of a star to have a
change in amplitude of more than one magnitude. The Distinction Between
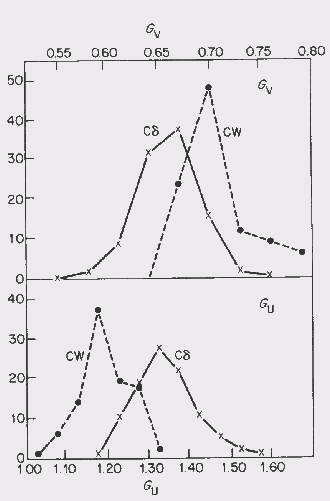
Classical and CW Cepheids An interesting method of distinguishing the two
types was produced in 1969. Its principle is simple: let These ratios define the energy
distribution in the spectra very simply, and they have
characteristics of a given type of variable star. A plot using observed
data to determine the type of Cepheid
variable The dispersion is large and it can be
seen that the plots overlap. However this seems to be the
best method for determining which type of category a
particular cepheid belongs to.
![]() be the total amplitudes of the variations in V, B and U respectively.
The following ratios are calculated:
be the total amplitudes of the variations in V, B and U respectively.
The following ratios are calculated:
[ QUANTUMWEB SOFTWARE | QUANTUMWEB PUBLISHING ]